Excel - Prevent ActiveX combobox from entering value outside validation list
ActiveX combo box in excel allows a user to type and auto select the word from the list. By default , if you type a word that is outside the "List fill range", combo box still accepts it.
In this post I will show you how to tweak the combo box control to restrict any input outside the "List fill range". In addition I will also show you how to make your combo box "List fill range" to be dynamic using tables in Excel.
In this post I will show you how to tweak the combo box control to restrict any input outside the "List fill range". In addition I will also show you how to make your combo box "List fill range" to be dynamic using tables in Excel.
Step 1: Insert ActiveX combo box
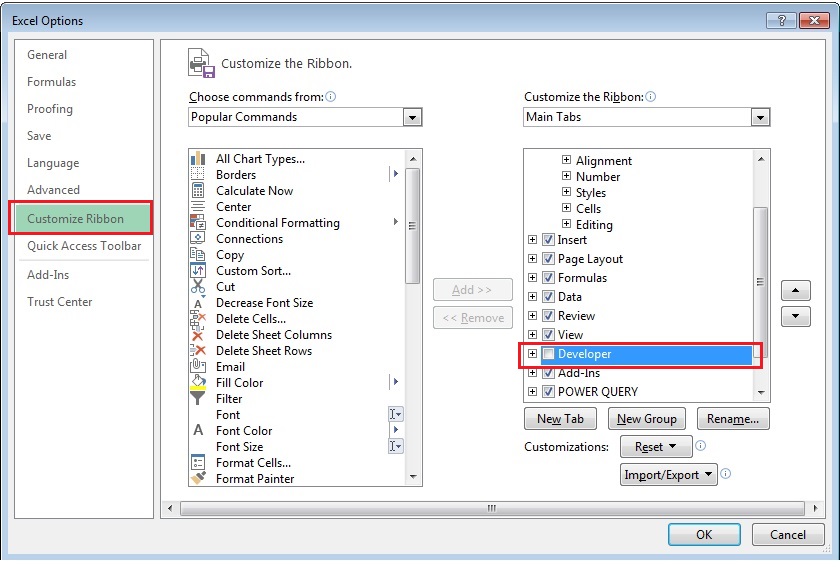
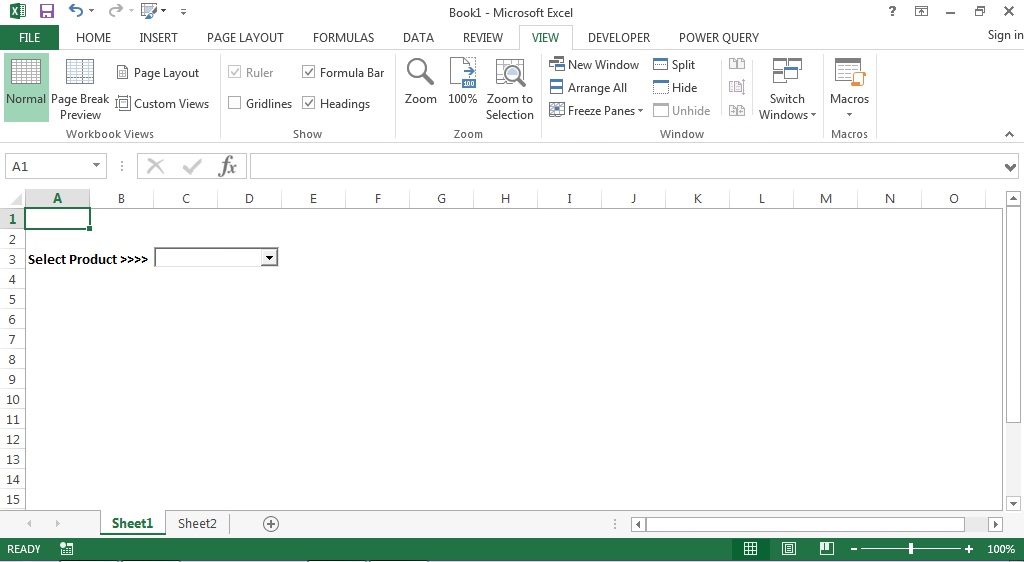
To insert a combo box ensure that you have enabled the Developer tab in your ribbon. If you haven't then go to File - Options - Customize Ribbon. Check the Developer tab on the right. On the Developer tab, go to the Form controls drop down and select insert combo box from ActiveX form controls. Draw the combo box on any excel sheet you want.

Step 2: Convert your list to Excel Table
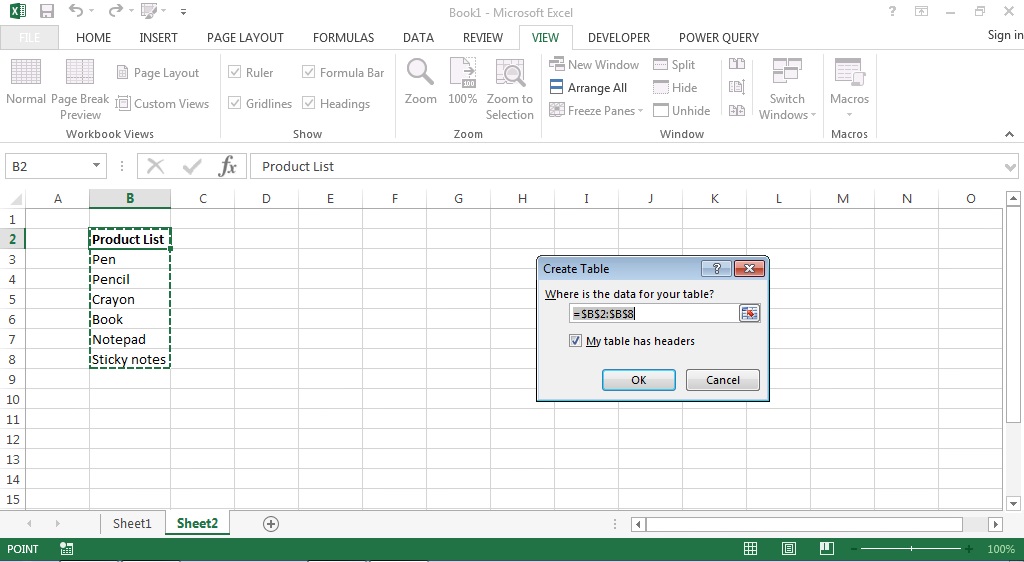
In this illustration, I have drawn the combo box on sheet1 and my list is in Sheet2. Convert your list to excel table by pressing Ctrl + T.
Step 3: Assign table values as "List fill Range" for the combo box
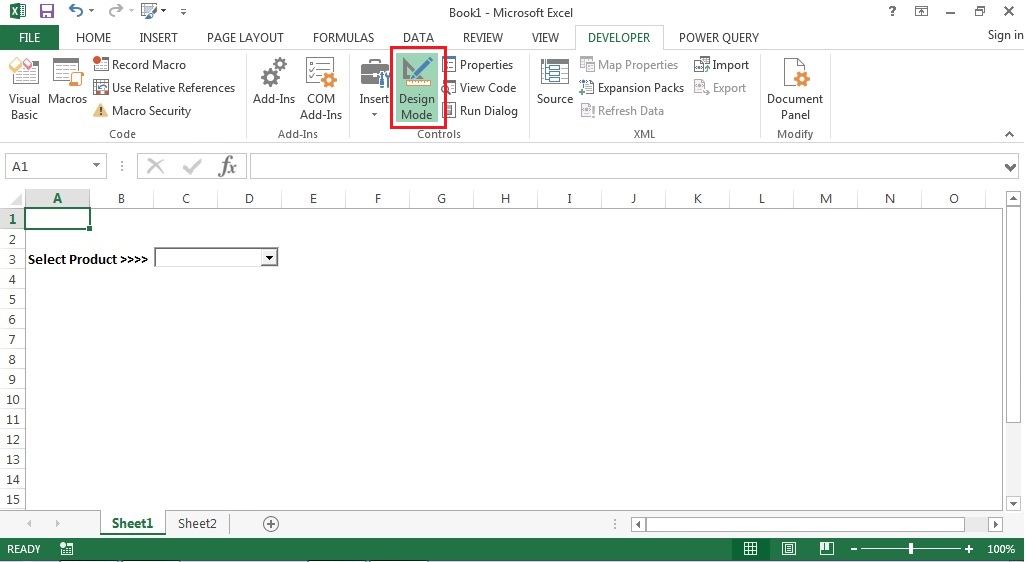
With the Design mode on, double click the combo box to enter the code in Visual Basic Editor.
By default, your cursor will appear inside ComboBox1_Change() event handler. We will be using ComboBox1_Click() event handler to fill the combo box with the product list. Whenever the combo box is clicked, the code written in the Click event handler will assign the values in the table to the combo box.
You can copy paste the code given below
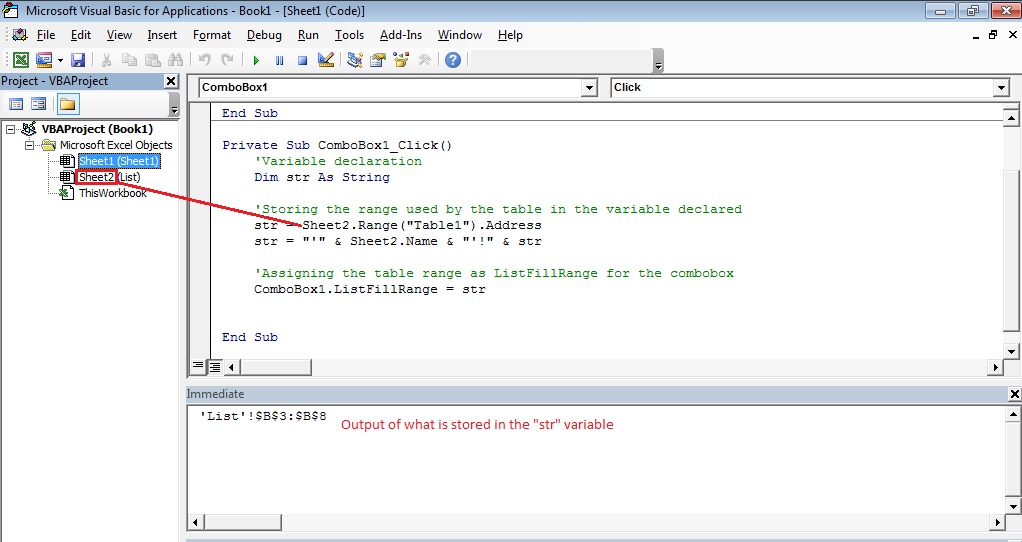
Private Sub ComboBox1_Click()
'Variable declaration
Dim str As String
'Storing the range used by the table in the variable declared
str = Sheet2.Range("Table1").Address
str = "'" & Sheet2.Name & "'!" & str
'Assigning the table range as ListFillRange for the combobox
ComboBox1.ListFillRange = str
'Linking cell A1 to show the combox value
ComboBox1.LinkedCell = "'" & Sheet1.Name & "'!" & "A1"
End Sub
I renamed Sheet2 which contained the table to "List". However, in the code written I continue to use the VBA sheet name and not the literal sheet name that is visible. This will ensure that your code runs perfectly even if you change the sheet name later.
Step 4: Preventing the combo box from accepting a value outside the ListFillRange
In order to prevent the combo box from accepting a value outside the ListFillRange, I will be using the LostFocus event handler to evaluate if a match was found or not. If a match is not found then we will set the value of the combo box to nothing.("").
Use the code given below and paste it after the Click event handler
Private Sub ComboBox1_LostFocus()
If Not ComboBox1.MatchFound Then
ComboBox1.Value = ""
End If
End Sub

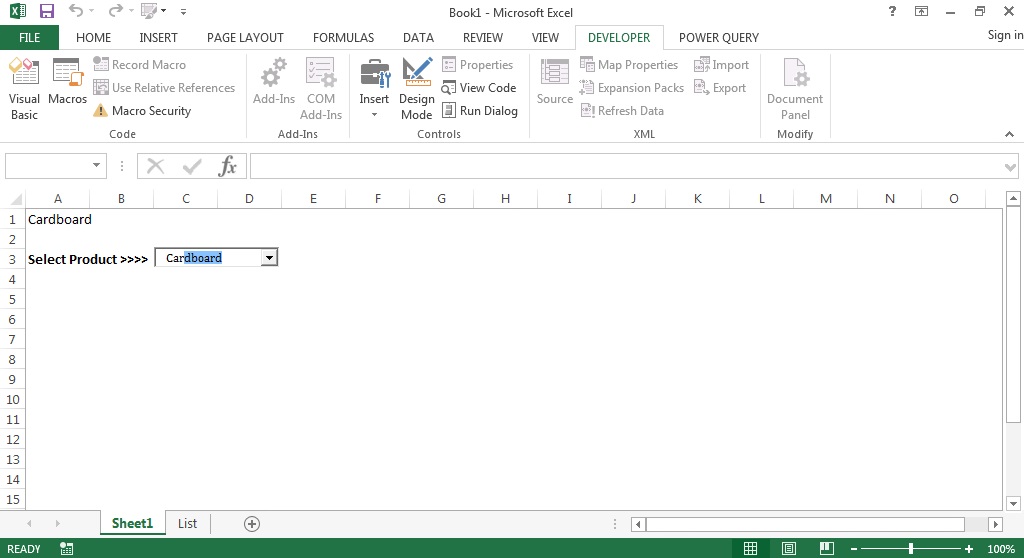
Step 5: Testing

Added a new value to the table, "Cardboard"
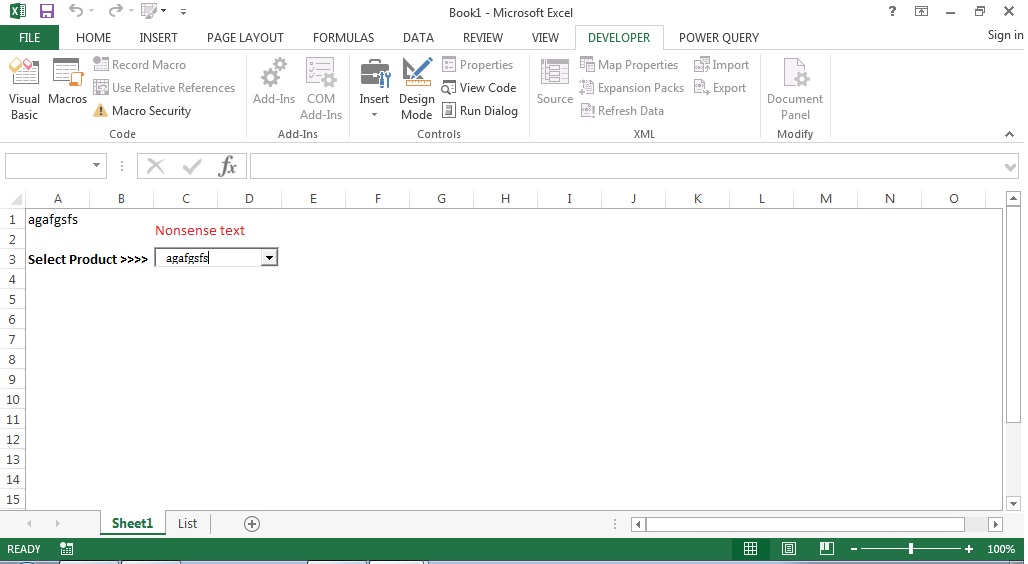
Typing nonsense text and checking the combobox. Cell A1 reflects the nonsense text as it is typed. However, the moment you click on any cell in the sheet combox loses focus and the handler sets its value to nothing("").
Thank you for reading!
If you liked the trick or have any questions, let me know in the comments section below.


